
4n6ir.com
Crashing into a Hint
by James Habben
I haven’t spent much time looking at crash dumps, but I ran into one recently. I had a case that presented me with little in the way of sources for artifacts. It forced me to get creative, and I ended up finding a user-mode crash dump that gave me the extra information I needed. It wasn’t anything earth-shattering, but it could be helpful for some of you in the future.
The case was a crypto ransomware infection. Anti-virus scans had already wiped out most of the infection, but the question was how it got onto the box in the first place. I determined to a reasonable certainty that a malicious advertisement exploited an out of date flash plugin. The crash dump gave me the URL that loaded the flash exploit. Let’s get the basics out of the way first.
Crash Dump Files
There are several different types of user-mode crash dumps that can be created. The default, starting in Windows Vista, is to create a mini dump, but true to Windows, you can change those defaults in the registry.
The default location drops them in the user profile folder for all applications. The path looks something like this:
- C:\uses[user]\AppData\Local\CrashDumps
The filename convention is pretty simple. It starts with the name of the process. Then includes the process identifier (PID). Last is the extension of dmp. All together, it looks like this:
- process.exe.3456.dmp
Forcing a Crash Dump
You can go look in that directory on your computer, and very likely find a few of those crash dumps hanging out. Any process will cause a crash dump file to be created, so it can be a great sign of user activity on the box in absence of other indicators.
If you see no files in that folder, or an absence of that folder altogether, RUN! Go get yourself a lottery ticket! It just means you haven’t used your computer for more than reading this blog post. Don’t worry though because Sysinternals has another useful tool that you can employ for giving you sample crashes.
ProcDump is a command line tool that allows you to customize the dumps and set up all kinds of triggers on when to create the dumps. Great functionality if you are a developer tracking down that pesky bug in code, but doesn’t do much for us in forensics. Best part about this tool is that it creates the crash dumps without having to actually crash the program.
Here are the commands I used while researching this further and dropping some dummy data to use in screen shots. The number is the PID of the process that I wanted. You can use the name, but you have to make sure there is only one process with that name or it bails out. I used the PID because I was going against Internet Explorer and even a single tab creates at least two processes.
- Procdump 1234
- Procdump –ma 1234
The –ma switch creates a crash dump with the full process memory. Otherwise, the only difference in the dump file when using ProcDump is that the naming convention uses the current date and time instead of PID.
Analyzing the Dump File
The dump file in my case originally stuck out to me because of the timeline I built. I had a pretty specific time based on a couple other artifacts, so I crashed into it by working backwards in time. Exploit code can often crash a process when encountering unexpected versions or configurations. The flash player was probably older than expected by the code.
Fact #1:
- IE crashed during relevant time window.
I started by looking around for tools to analyze these dump files. I used IDA Pro and WinDbg, but decided it wasn’t giving me any useful information. I ended up going old school forensics on it.
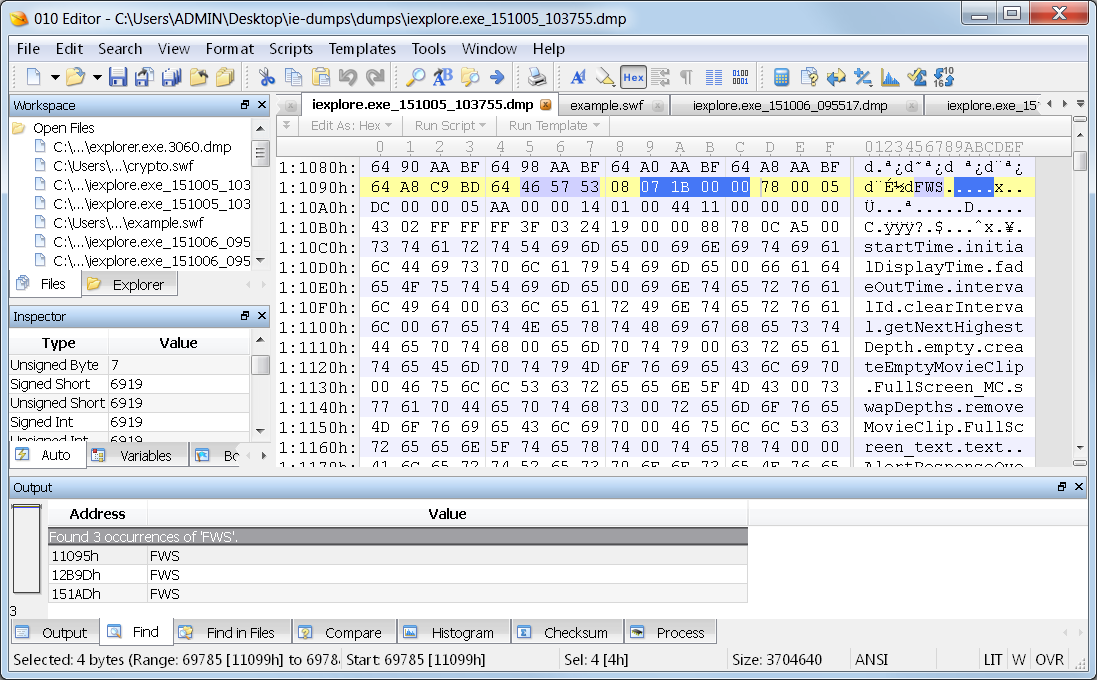
I have some screen shots to show you the goods, but of course the names have been changed to protect the innocent. Here we go with sample data. I search for ‘SWF’ and locate several hits. One type of hit is on some properties of some sort.
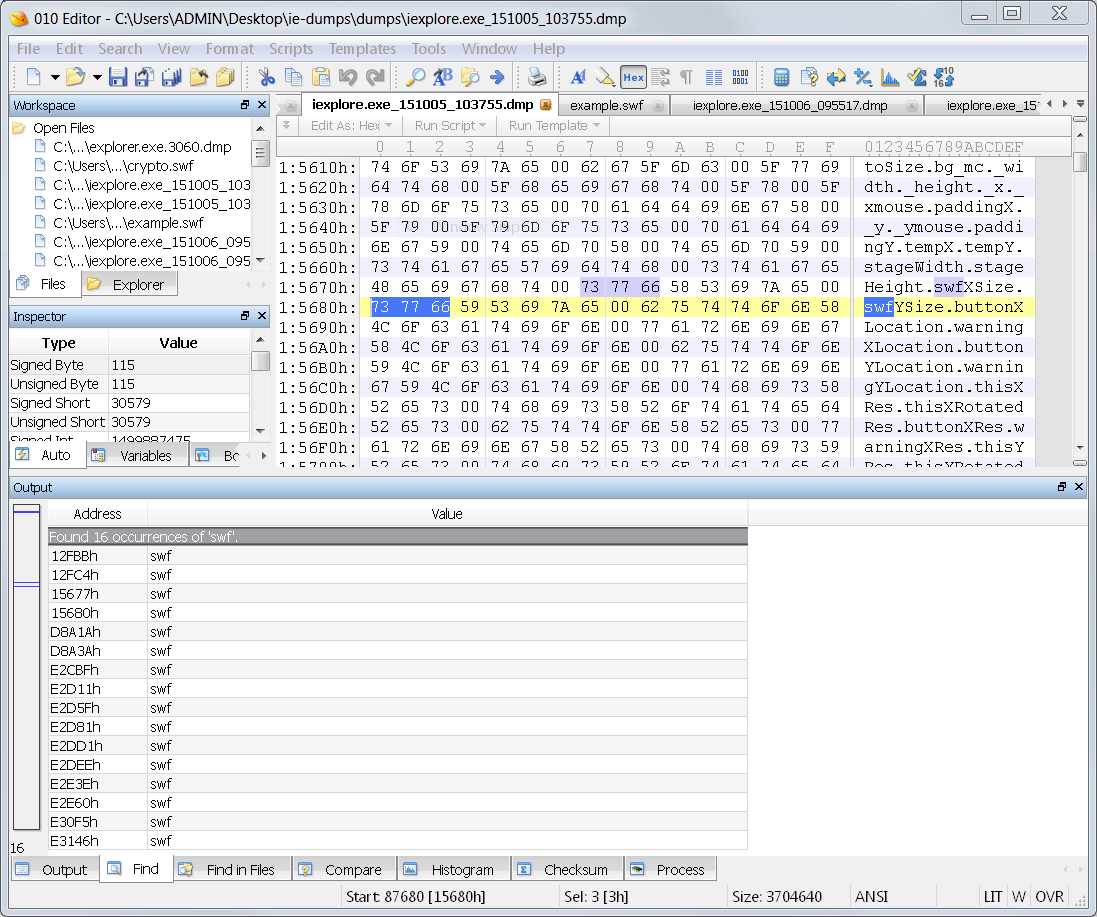
Another type of hit is a structure that contains a URL of a SWF file that was loaded. Alongside that URL is another for the page that loaded the SWF URL.
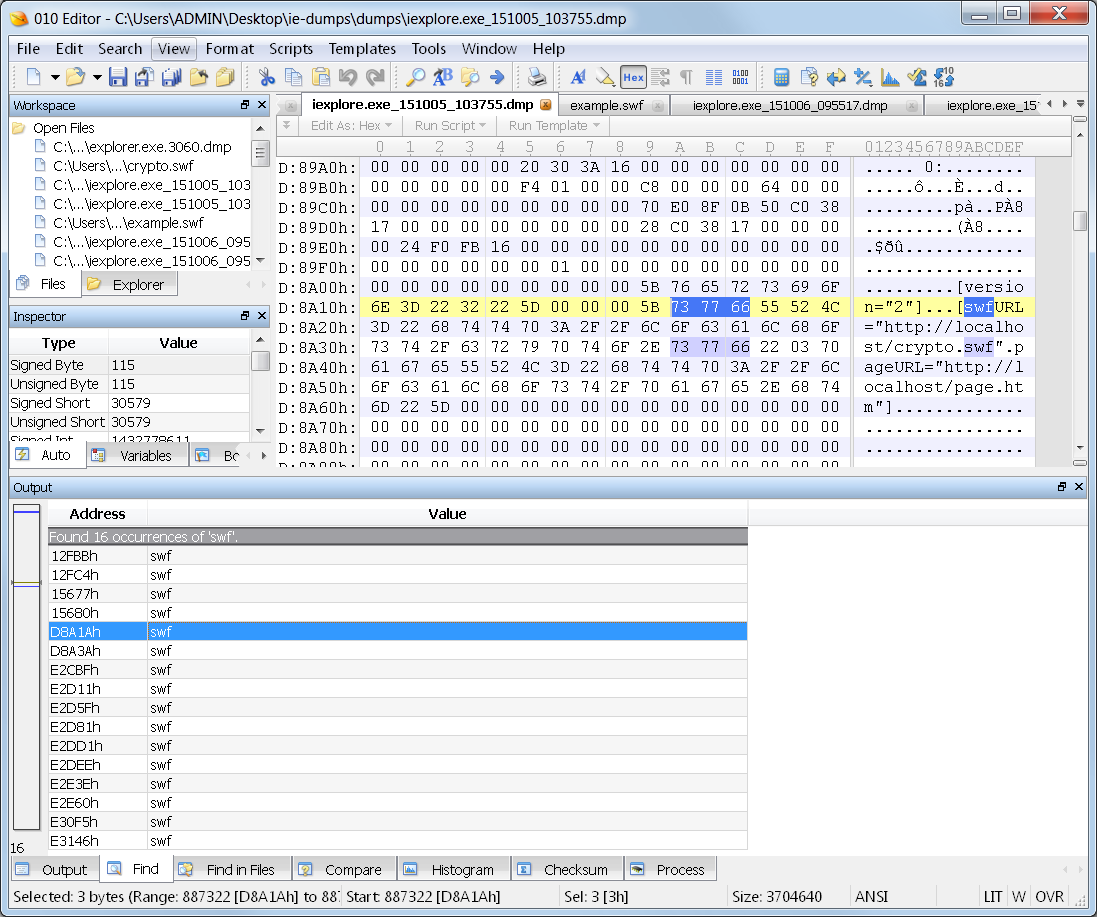
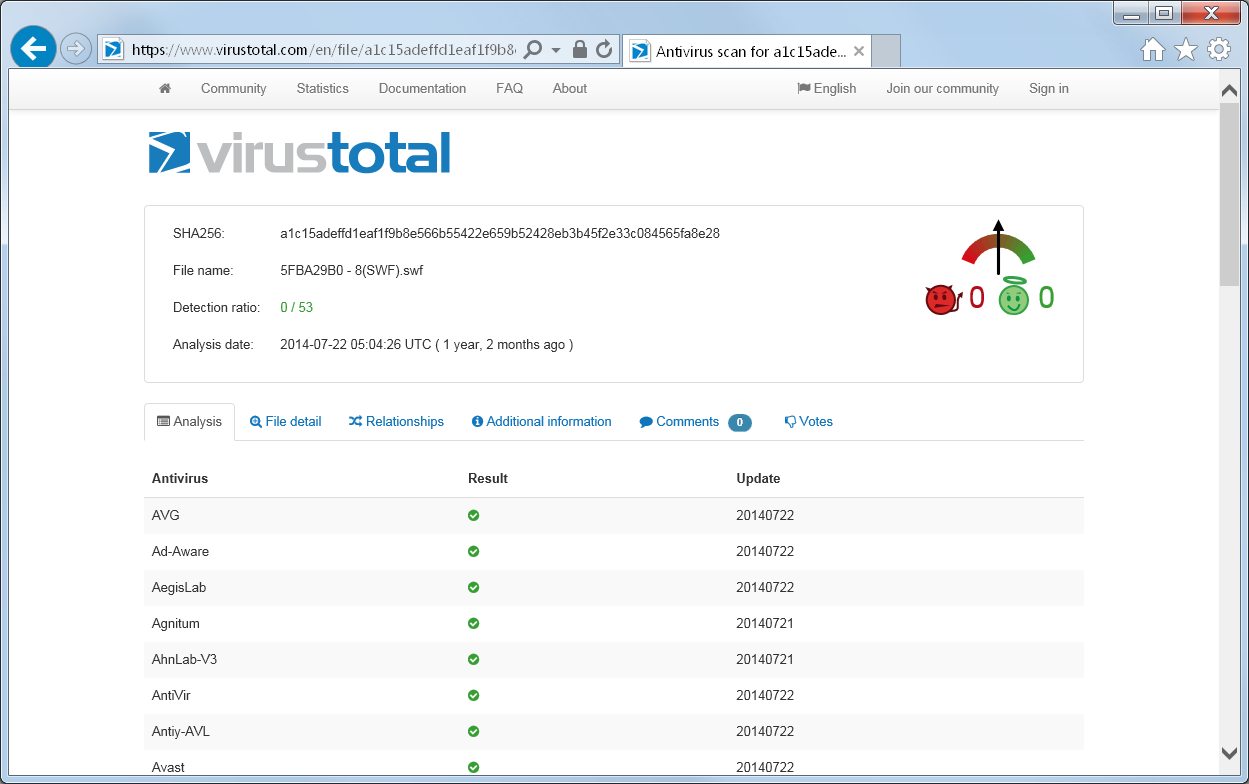
At this point in my case, I took all of the URLs that I found associated with these SWF hits, and I loaded them up in VirusTotal for evaluation. Sure enough, I had one that was caught by Google. The others showed it as being clear, but this was only a few days after the infection. I checked it again a couple days later and more were detecting it as malicious.
Fact #2:
- Internet Explorer loaded a SWF file from a URL that has been detected as malicious.
Dump Containers
The default dump type is mini dump, which contains heap and stack data. These files contain parts of the process memory, obviously, so maybe they contain actual flash files? I wanted to find that out to confirm the infection.
The CPU does not have direct access to hard disk data, so it relies on the memory manager to map those files into memory. This means that, most of the time, files sit in memory just like they do on disk. Here is the specfor SWF files (PDF). With this information I can prepare a search for the header. I will print a snippet of the spec here for reference.
http://wwwimages.adobe.com/www.adobe.com/content/dam/Adobe/en/devnet/swf/pdf/swf-file-format-spec.pdf
| Field | Type | Comment |
|---|---|---|
| Signature | Signature byte: | “F” indicates uncompressed |
| “C” indicates a zlib compressed SWF (SWF 6 and later only) | ||
| “Z” indicates a LZMA compressed SWF (SWF 13 and later only) | ||
| Signature | UI8 | Signature byte always “W” |
| Signature | UI8 | Signature byte always “S” |
| Version | UI8 | Single byte file version (for example, 0x06 for SWF 6) |
| FileLength | UI32 | Length of entire file in bytes |
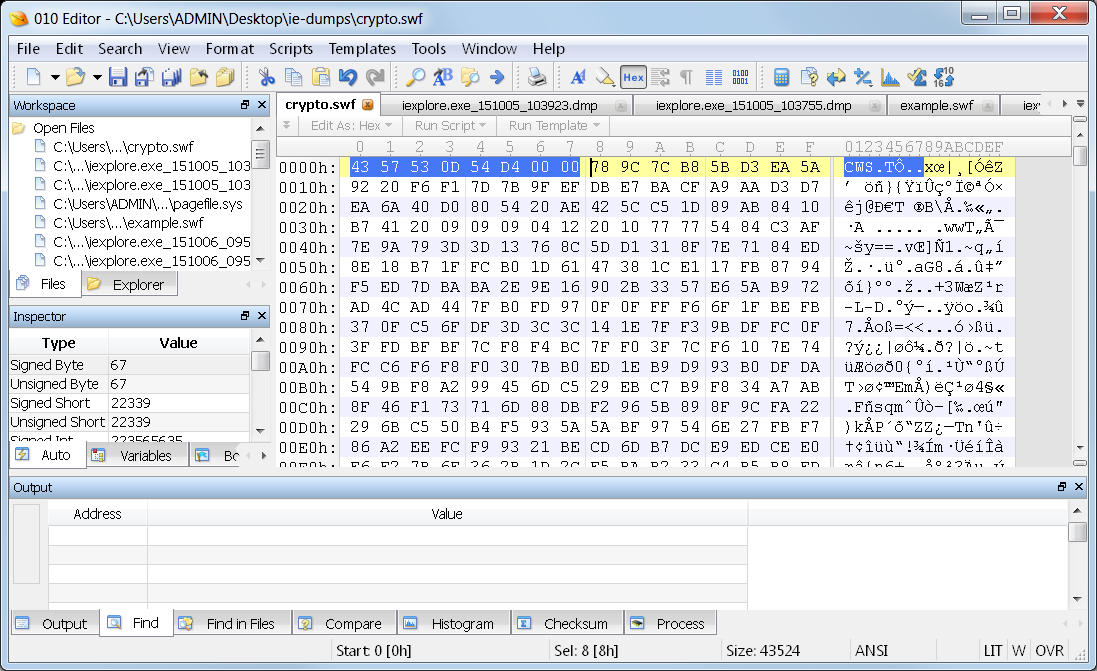
I compare that with several SWF files that I have available, and find them to all use CWS as the header.
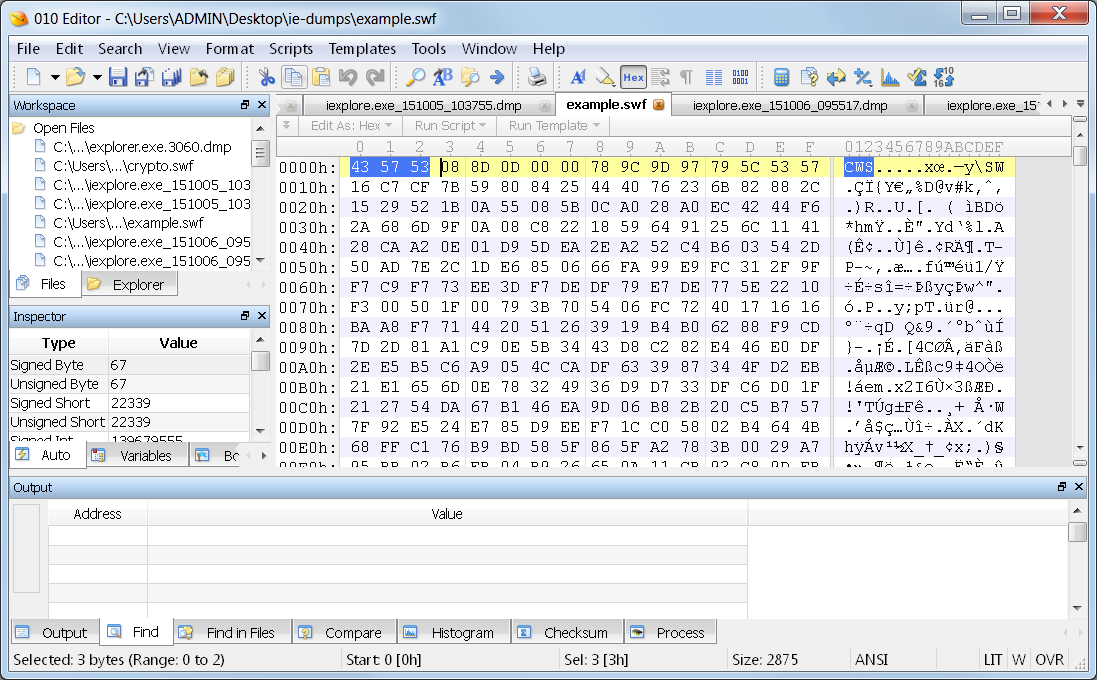
This means they are all compressed, and rightfully so since they are being sent over the internet. In the dump file, however, I come up with zero hits for CWS. I do locate 3 hits for FWS in the dump file.
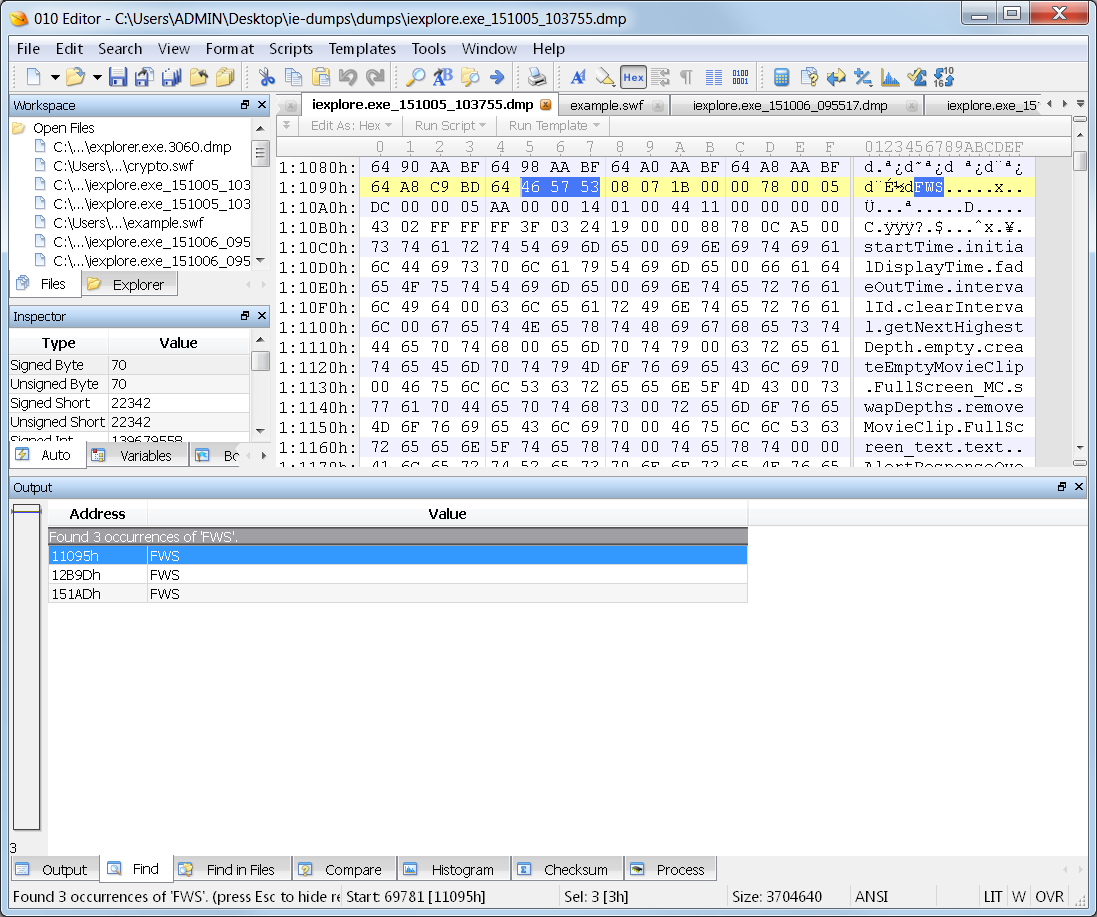
Aha! Nailed this sucker! Now I just need to determine which of these contains the exploit code.
Carving SWF Files
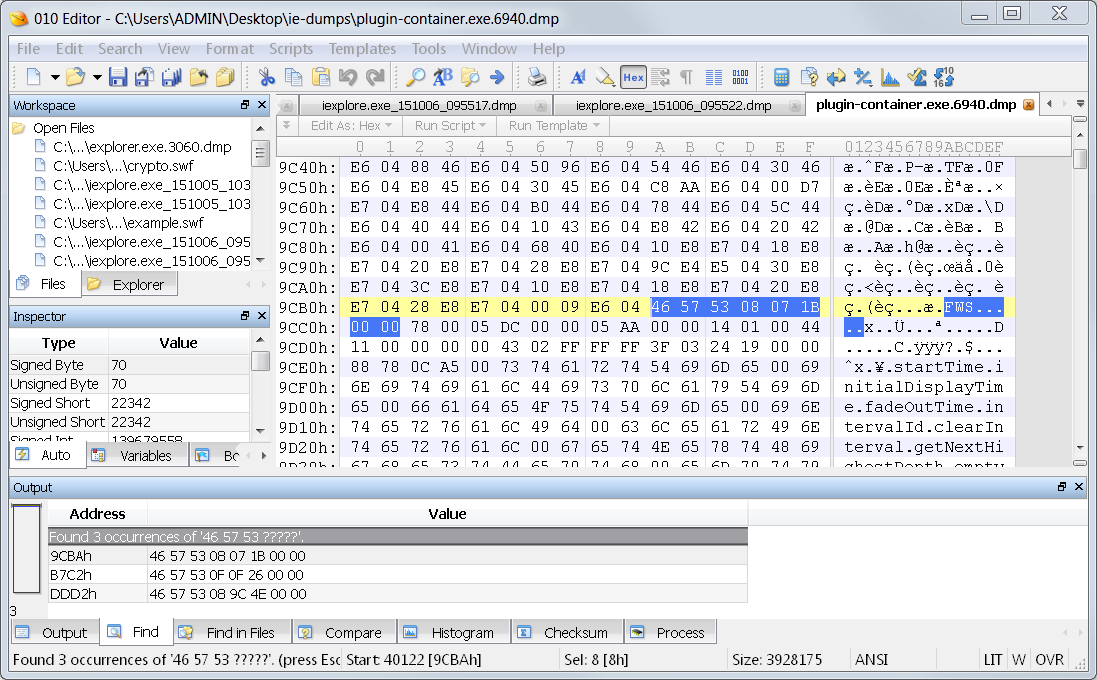
Now I want to get these SWF files out of here. There is a small potential for files to be fragmented in memory, but the chances are generally pretty slim for small files like this. I start working on the headers that I have located. Fortunately, the F in FWS means that it is uncompressed. This means that the value for the file size field will be accurate since it always shows the size of the uncompressed version of the file.
The size field tells the size of the file from the start of the header. So I start my selection at the FWS and go for a length of 6919 in this file pictured.
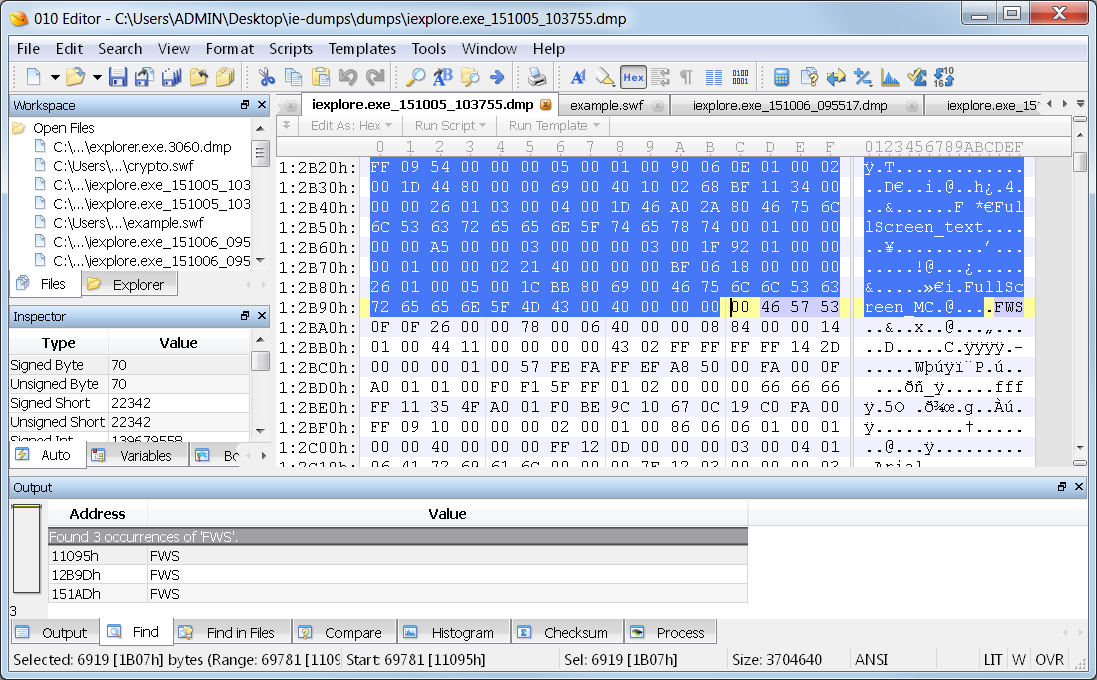
As a confirmation of my file likely being in one piece, I see the FWS header for another SWF file following immediately after my selection. After selecting this file, I export it. I can now hash it and take the easy way out.
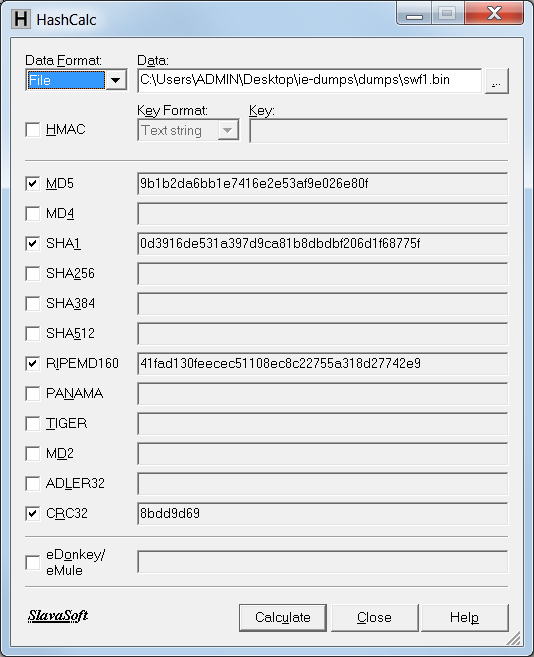
Now the easy way.
Dang! I do the same process for the other 2 hits, and I get the same result for all 3 of these. I have 3 SWF files loaded in my crash dump, but none of them are malicious. My curiosity is now getting the better of me, and I need to know more!
I looked on a different computer and found a crash dump from Chrome. This computer even has a newer flash plugin installed than my sacrificial VM. Now I perform the same search on this crash dump, and I find an interesting result.
The Chrome dump:
The Internet Explorer Dump:
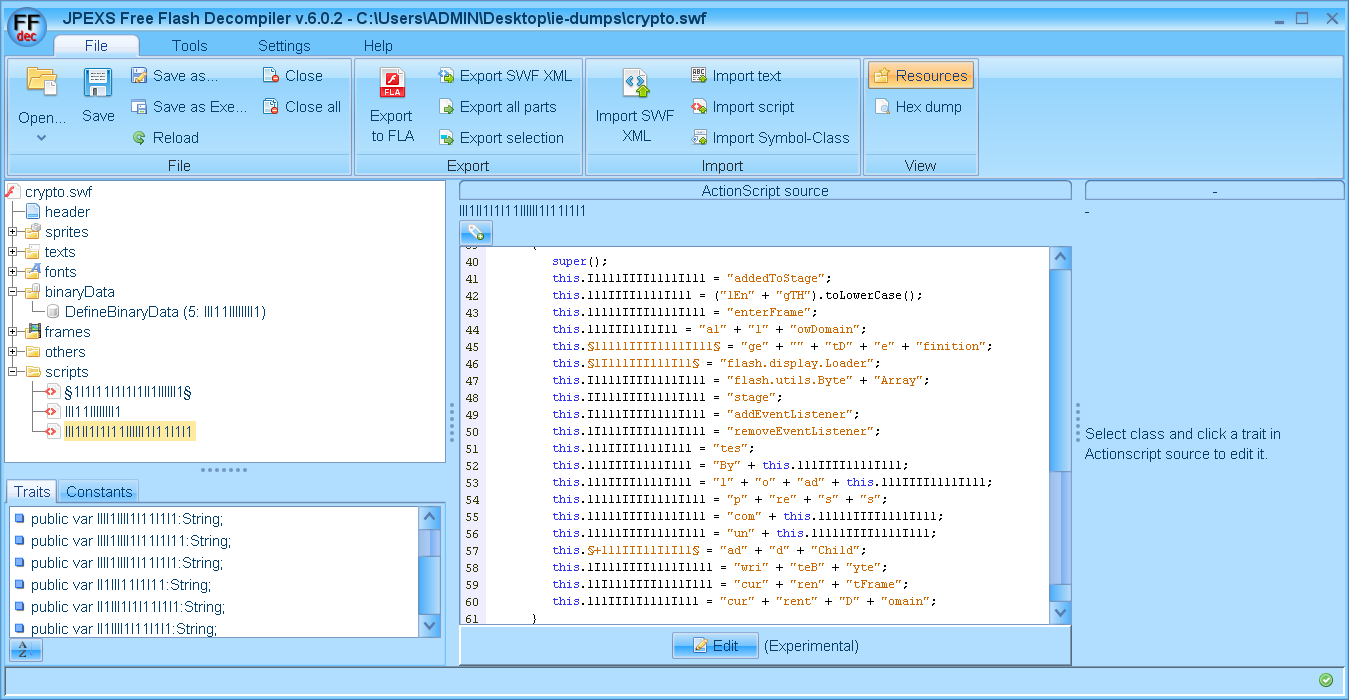
The hits have the same version numbers and file sizes. I did some poking around inside the SWF file, and I found these to be components built into the flash player. You can see one of them in this image.
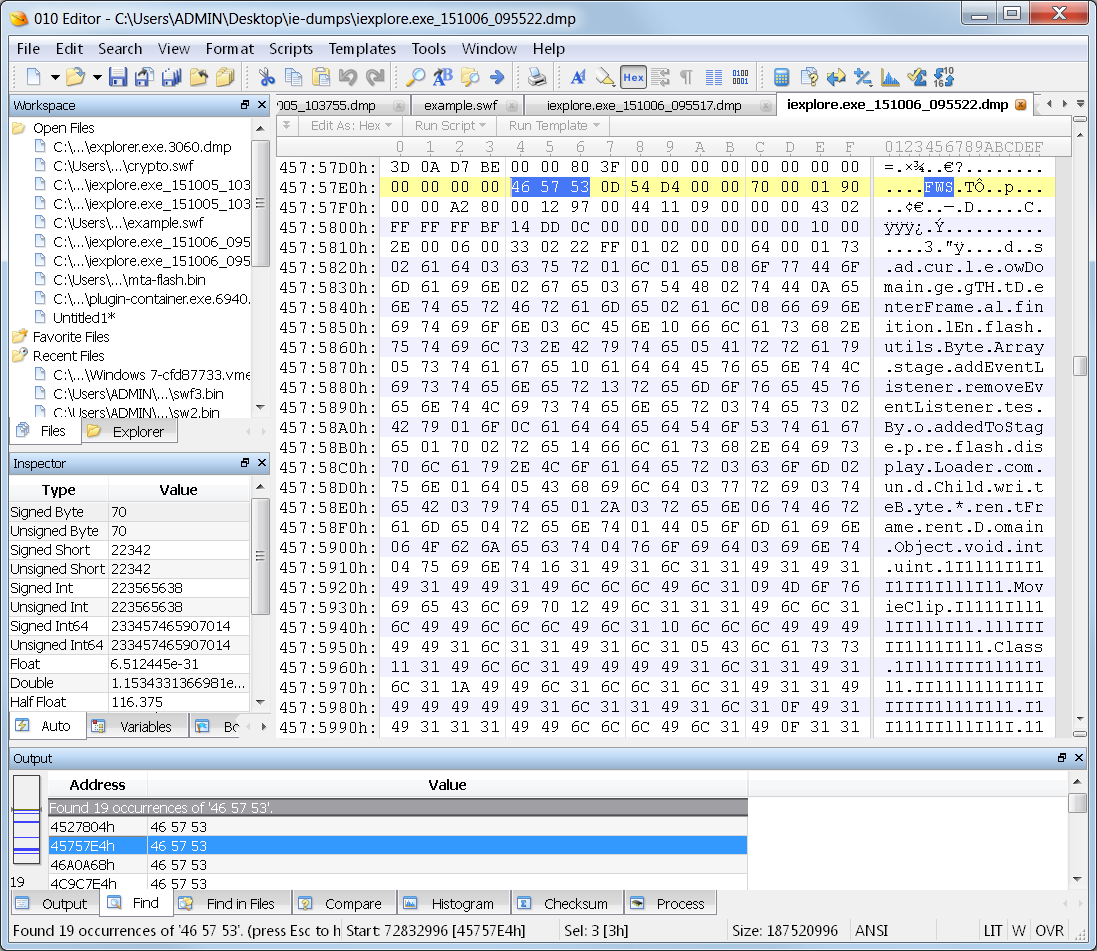
If I search one of the dumps that I made using the –ma switch of ProcDump, then I do find the exploit code. It is hidden amount many other hits. There are some funny looking strings at the top of this SWF file, but I will get to that in just a bit.
Collecting the Sample
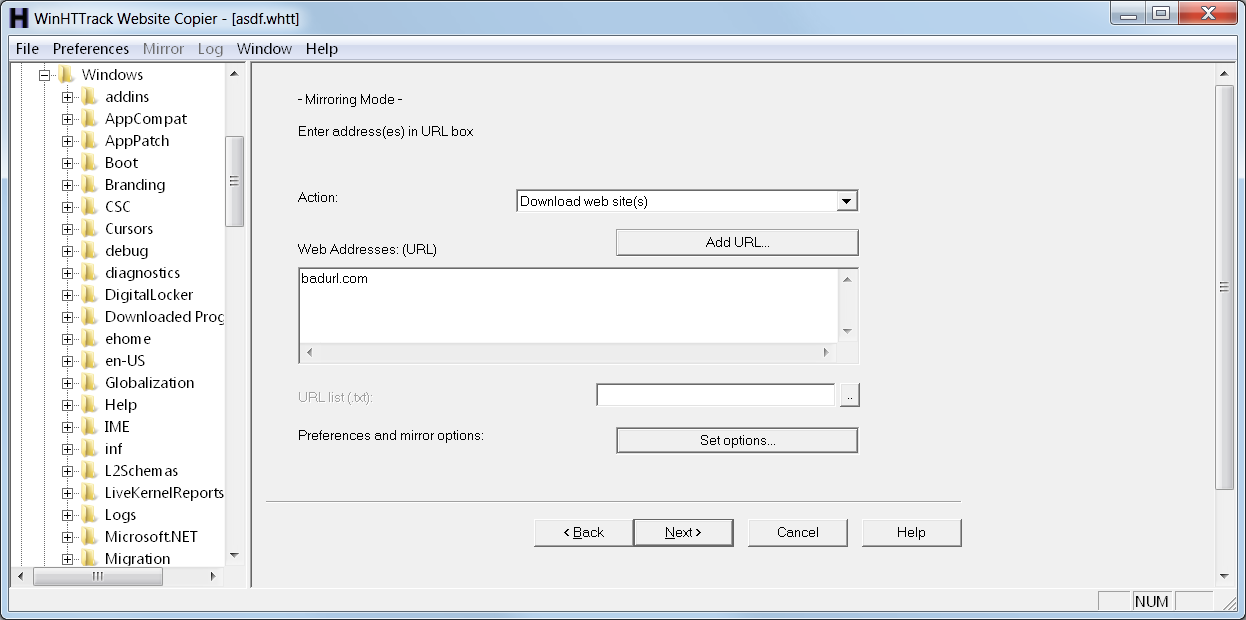
My favorite tool for collecting web based samples is HTTrack. It has a ton of configuration options including the ability to use a custom User Agent string and to route through a proxy server, such as TOR. It is a little easier to use than wget or curl, and it easily gives me the full context of the pages surrounding the sample.
Since I found the malicious URL in the IE crash dump, I can use that to pull down the sample for further analysis.
Analyzing the Sample
Once I have the sample collected, I can now pull it apart to see what’s going on. I won’t claim to be anything other than a novice when it comes to SWF files, but there are similar behaviors used across all sorts of malicious code that can stick out.
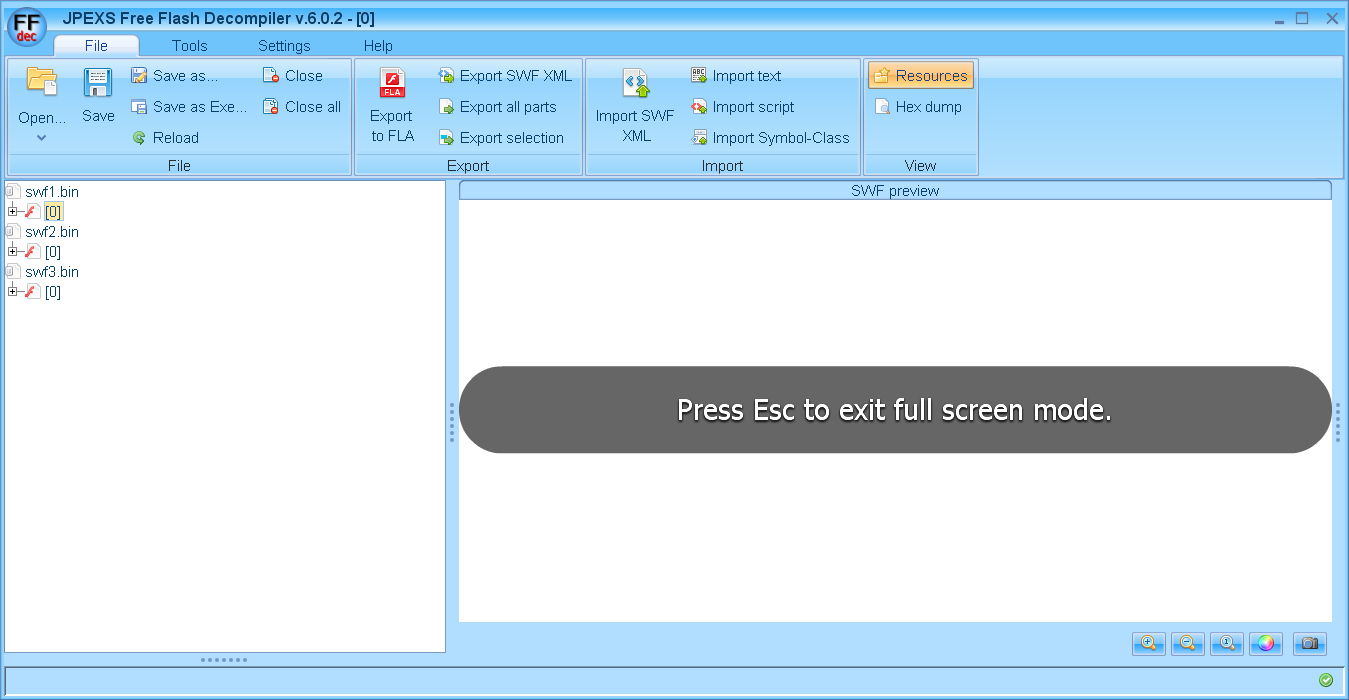
I use a couple tools for breaking down SWF files:
- http://www.swftools.org/download.html
- https://www.free-decompiler.com/flash/
I am not going into a ton of detail because there are many others that already cover this topic much better.
- http://x9090.blogspot.com/2009/05/swf-exploit-analysis-part-1.html
- http://malwageddon.blogspot.com/2015/03/data-obfuscation-now-you-see-me-now-you.html
- http://researchcenter.paloaltonetworks.com/2015/05/the-latest-flash-uaf-vulnerabilities-in-exploit-kits
- http://h30499.www3.hp.com/t5/HP-Security-Research-Blog/Playing-with-Adobe-Flash-Player-Exploits-and-Byte-Code/ba-p/6505942
With this exploit, it is pretty obvious from just a glance that it is not a normal SWF. Take a look at this image and tell me this is normal.
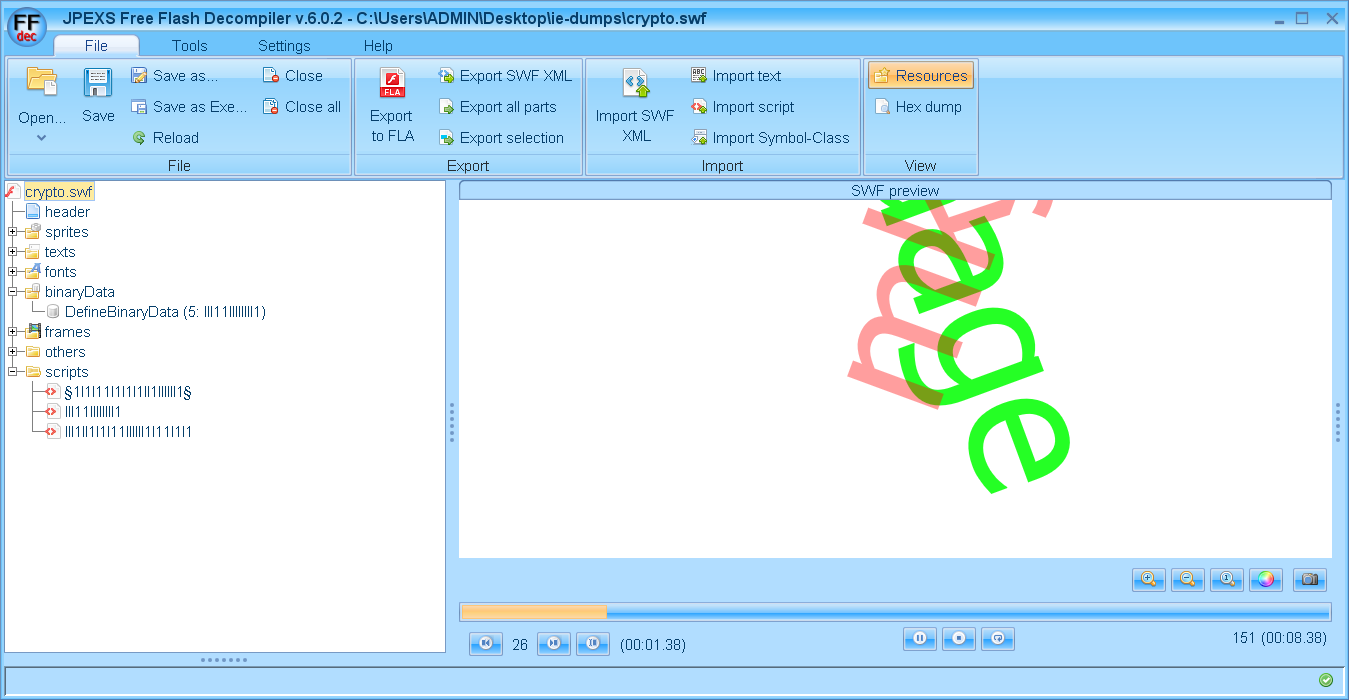
| A class named §1I1l11I1I1I1II1IlllIl1§, another named IIl11IIIlllIl1? Can you tell the difference between | , 1, I, l? That’s the idea! |
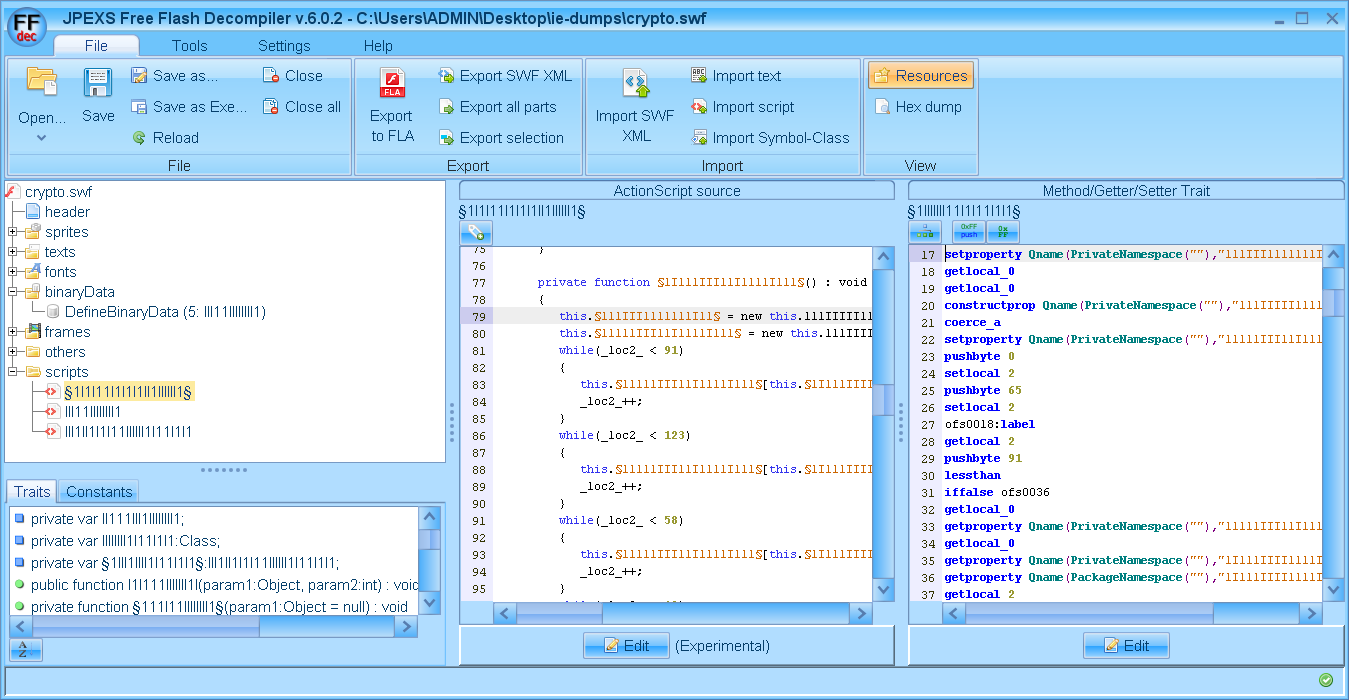
Then there are the strings from the header we saw earlier. They look like this in the code.
Easy Analysis
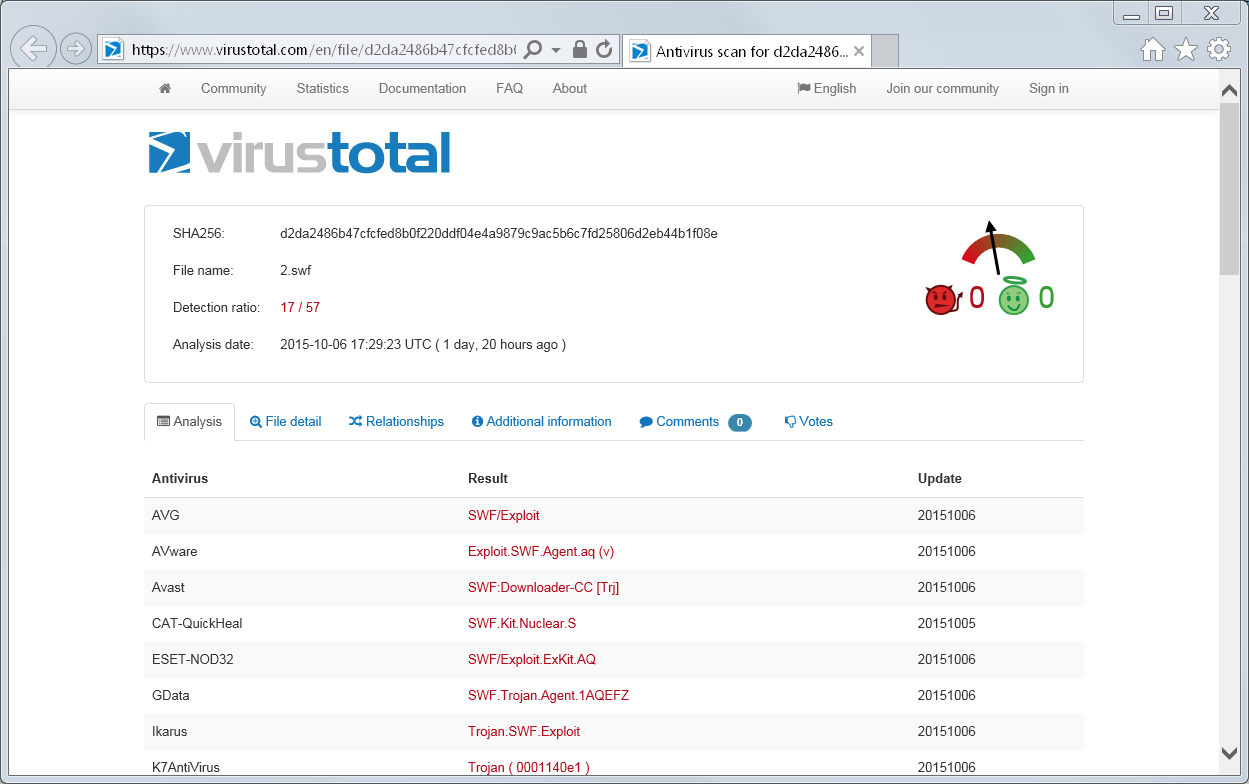
Now I use the easy button to confirm what I already suspect. I send the hash to VirusTotal and find that it has a pretty strong indication.
I already know the end goal of this sample, so I don’t want to waste time on this. You can read about my new perspective in an earlier post.
Fact #3:
- SWF sample contains obfuscated code and has a VT score of 17/57
The Last Piece
I need one more piece to complete the findings. Knowing how these files typically get onto disk is our jobs. If it was seen on the screen, then it had to have been in memory at some point in some form. If it was in memory for some time, then there is a fair chance that it has been paged out into swap. If it came from the internet, there is a strong chance that it touched the temporary cache, even if just for a second. If it touched the cache and was cleared out, then there is a reasonable chance of pieces still sitting in unallocated clusters. Follow the logic?
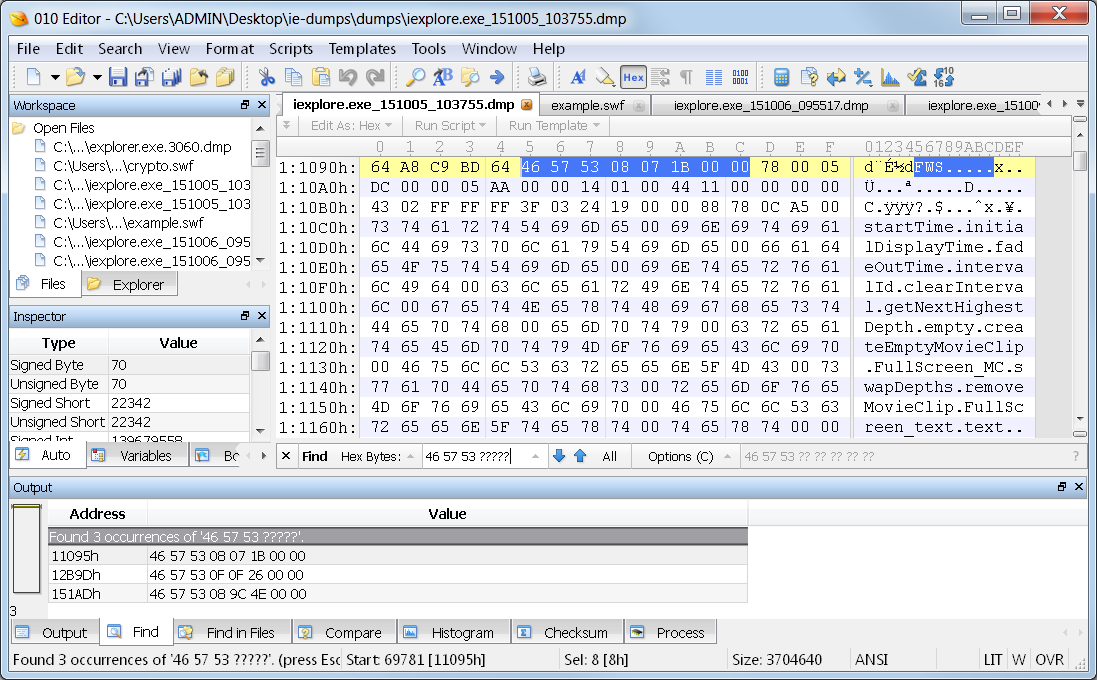
I prepare a search by grabbing the first 8 bytes of the sample.
We saw earlier that SWF files can be either compressed or uncompressed, with the difference indicated by the first character. I don’t know if this SWF file will be compressed, so my keyword will account for that by not forcing a C, as the sample has. Otherwise, this has the SWF signature, the file version, and the file size. It is no SHA256, but it’s unique enough for some confirmation to be made.
? 57 53 0D 54 D4 00 00
| Sure enough! The exploit SWF is located in pagefile.sys with this keyword. You can see those same broken strings and I | l1I names in there. Unfortunately, the nature of pagefile operation doesn’t always place file pieces together, nor does it even hold onto the entire copy of the file. |
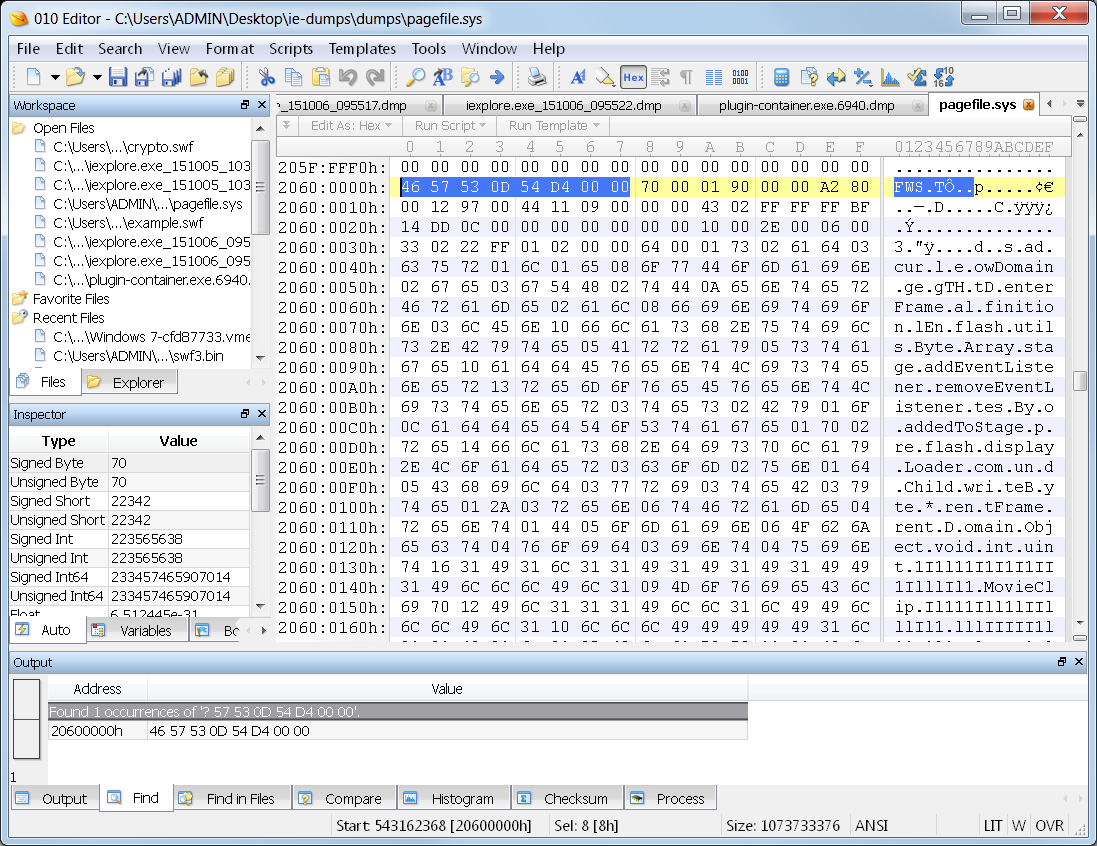
Fact #4:
- Exploit SWF code found in pagefile.sys
Putting It All Together
I walked you through some of the basic steps I used to discover the infection point. I did this without unallocated clusters, and with no browser history or cache. I put this together to challenge you.
Use your knowledge and be creative! You have a unique understanding of how many components of operating systems and applications work. Don’t get discouraged if your forensic tools don’t automagically dime out the culprit.
Here is a summary of what we found here:
- Fact #1: IE crashed during relevant time window.
- Fact #2: Internet Explorer loaded a SWF file from a URL that has been detected as malicious.
- Fact #3: SWF sample contains obfuscated code and has a VT score of 17/57
- Fact #4: Exploit SWF code found in pagefile.sys
What do you think? Enough to satisfy?
Here is the sample SWF I used for this walk through.
https://www.virustotal.com/en/file/d2da2486b47cfcfed8b0f220ddf04e4a9879c9ac5b6c7fd25806d2eb44b1f08e/analysis/
Be creative in your cases!
James
tags: Crash